The future of real estate decisions,all in one platform
Welcome to Plot.Ai, the platform that gives you the power you need to make the right decisions in the real estate market. Explore data, uncover hidden trends, and gain insights that put you ahead of the competition. All wrapped in a user-friendly, AI-driven solution that makes complex analyses simple.
We Fix What Slows You Down
Say goodbye to scattered information.
Plot.ai integrates multiple sources into a single, unified view.
No more outdated insights.
With Plot.ai, you get real-time data to stay ahead of market changes.
No more second-guessing the data.
Plot.ai strives to provide data of the highest quality, making sure you can do your analysis with confidence.
Break free from rigid tools.
Plot.ai provides a flexible, AI-powered platform tailored to your needs.
What is Plot.ai?
Plot.ai is an advanced, innovative platform for market intelligence and analysis that strives to deliver the best data in the real estate market. By analyzing market trends, areas, all projects, and units on the market, we ensure that real estate professionals can make informed, data-driven decisions with confidence.

Simpler and better
Our intuitive and powerful software opens the door to endless possibilities. Every decision becomes simpler and more accurate, turning each project into an opportunity to increase profitability and create value.
Daily
Updates
Intuitive
Software
Possibilities
Join our 1400 satisfied users
Request a demoPlot.ai features
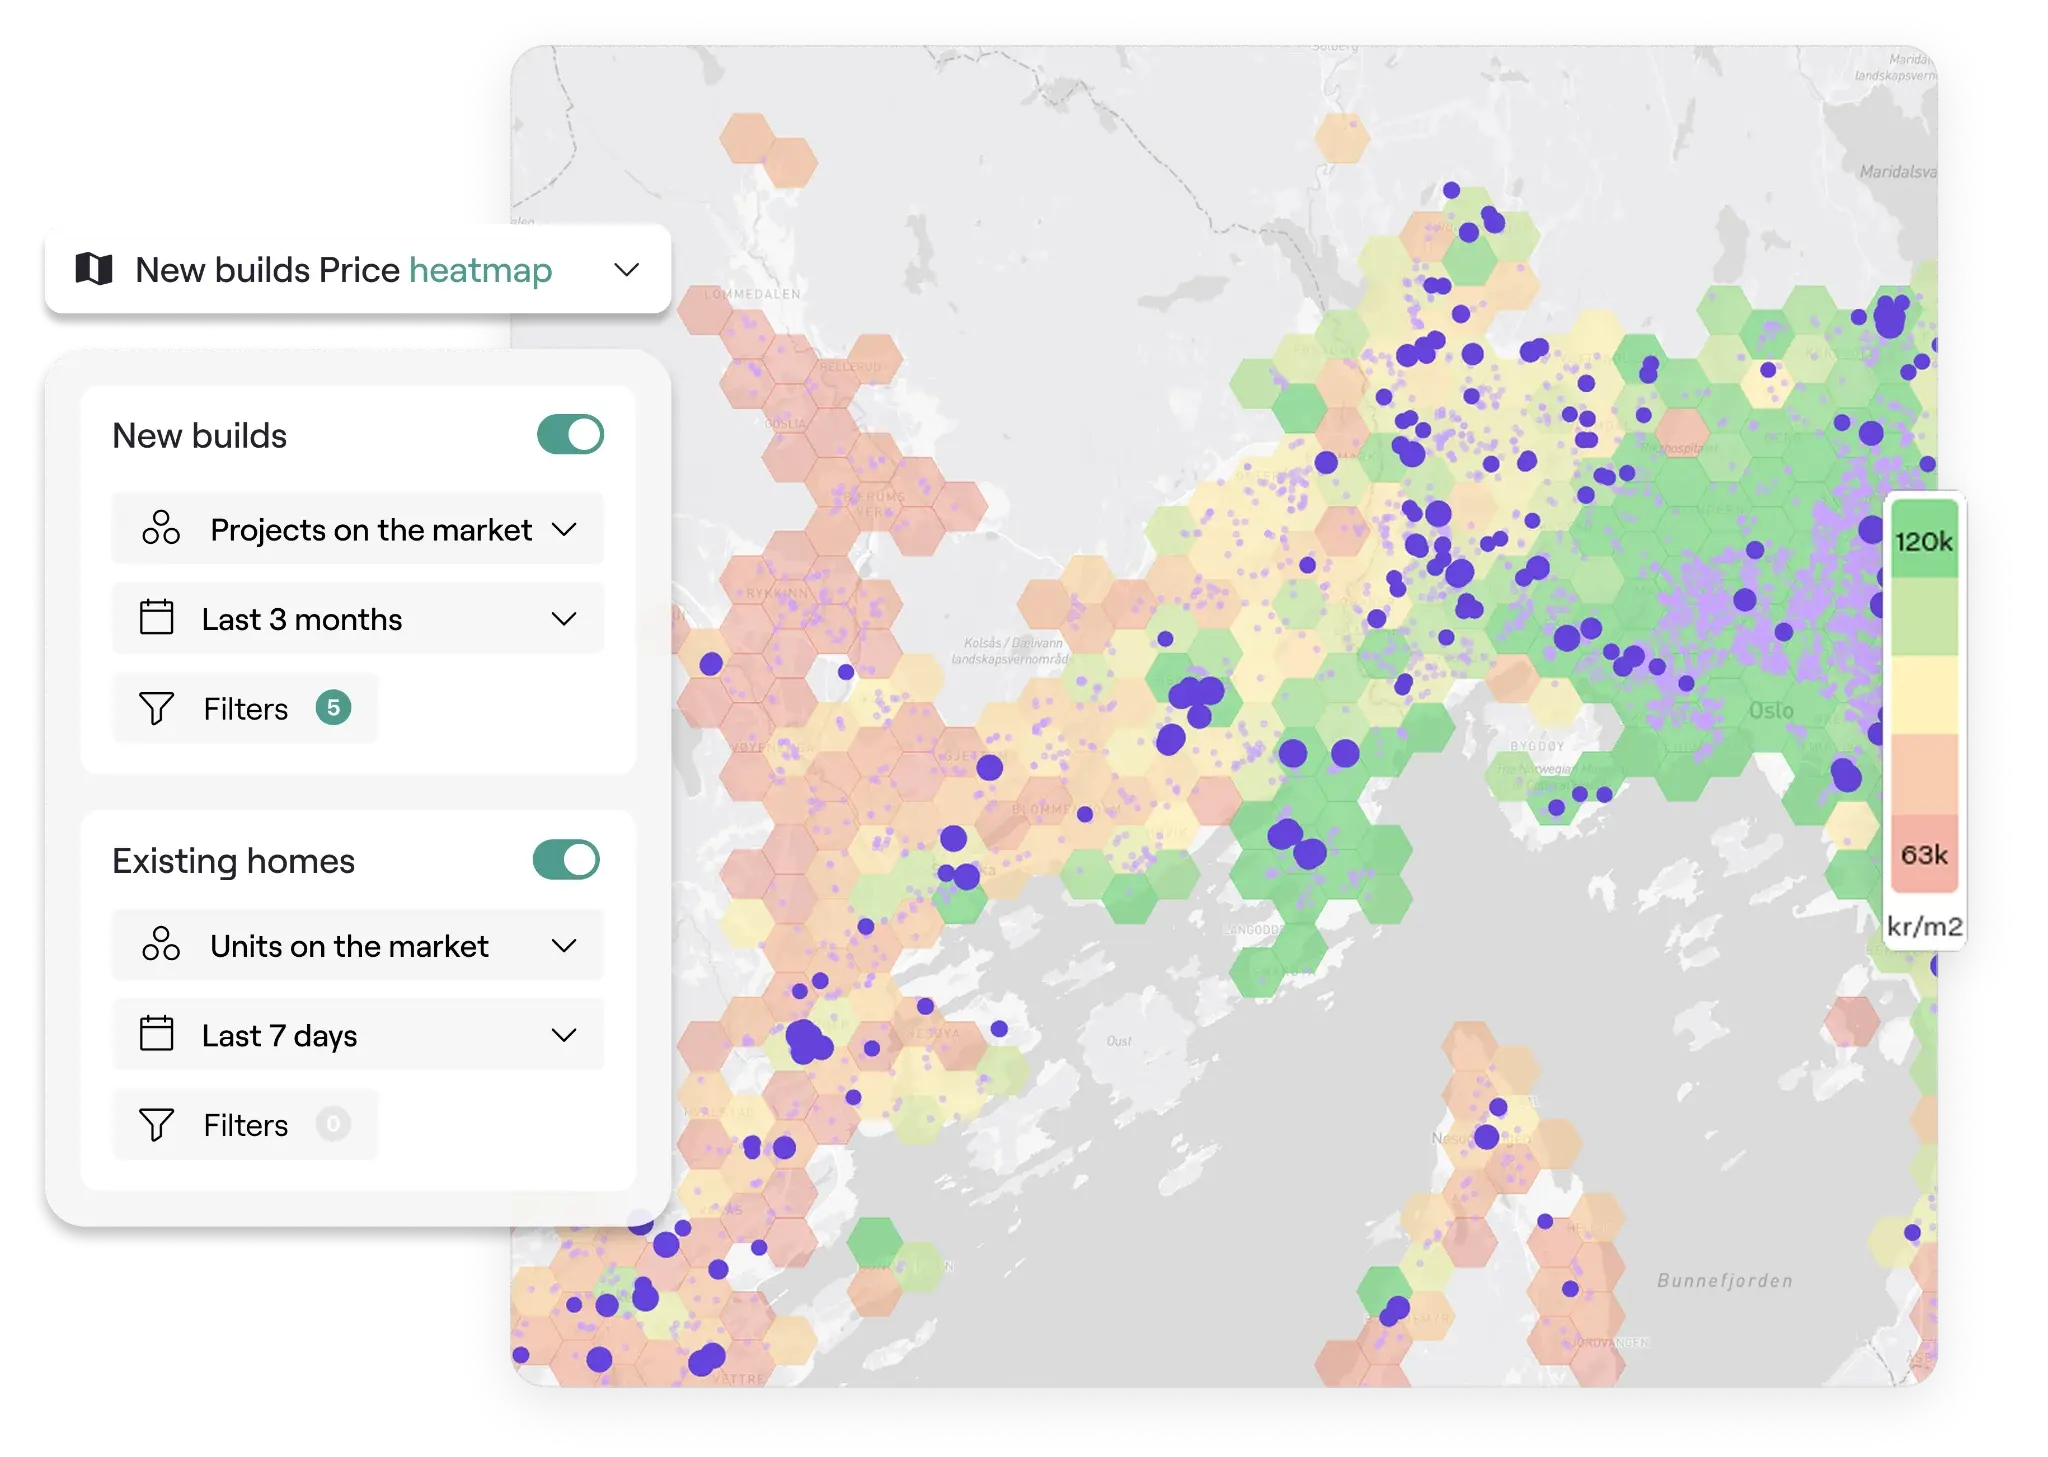
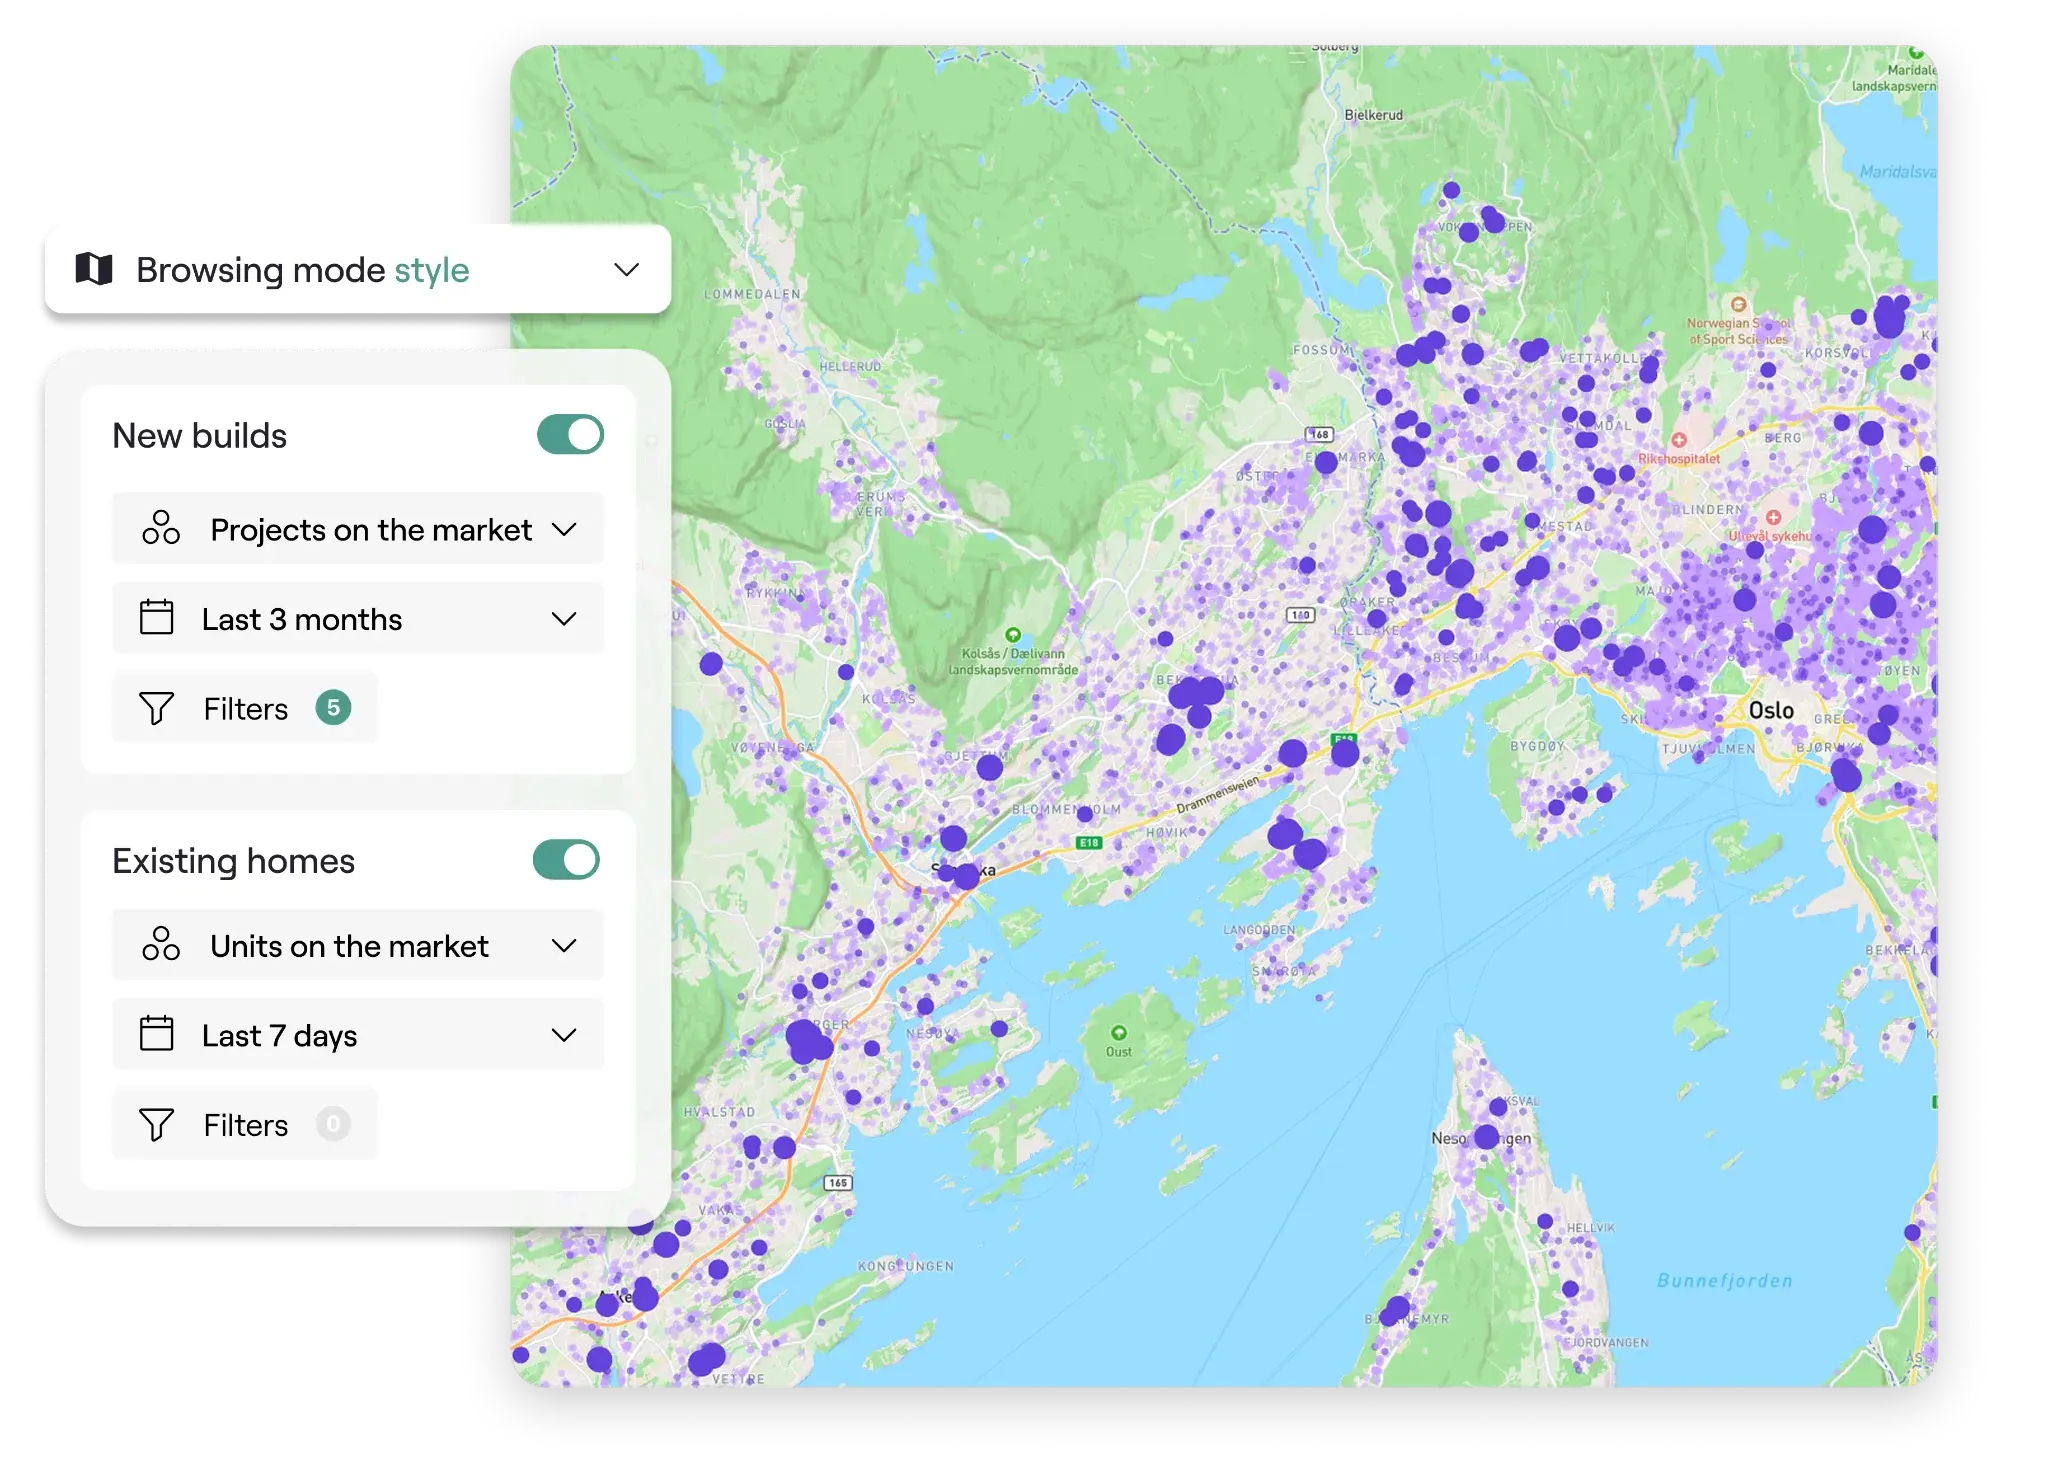
Intuitive Map Exploration
Visualize the market with maps! Discover trends previously hidden, and use filters to see what side of the river gives the better price
 Explore projects geographically, and see what's trending
- Visualize property mix, and compare regions to find the optimal solution
- Advanced heatmaps to better understand pricing
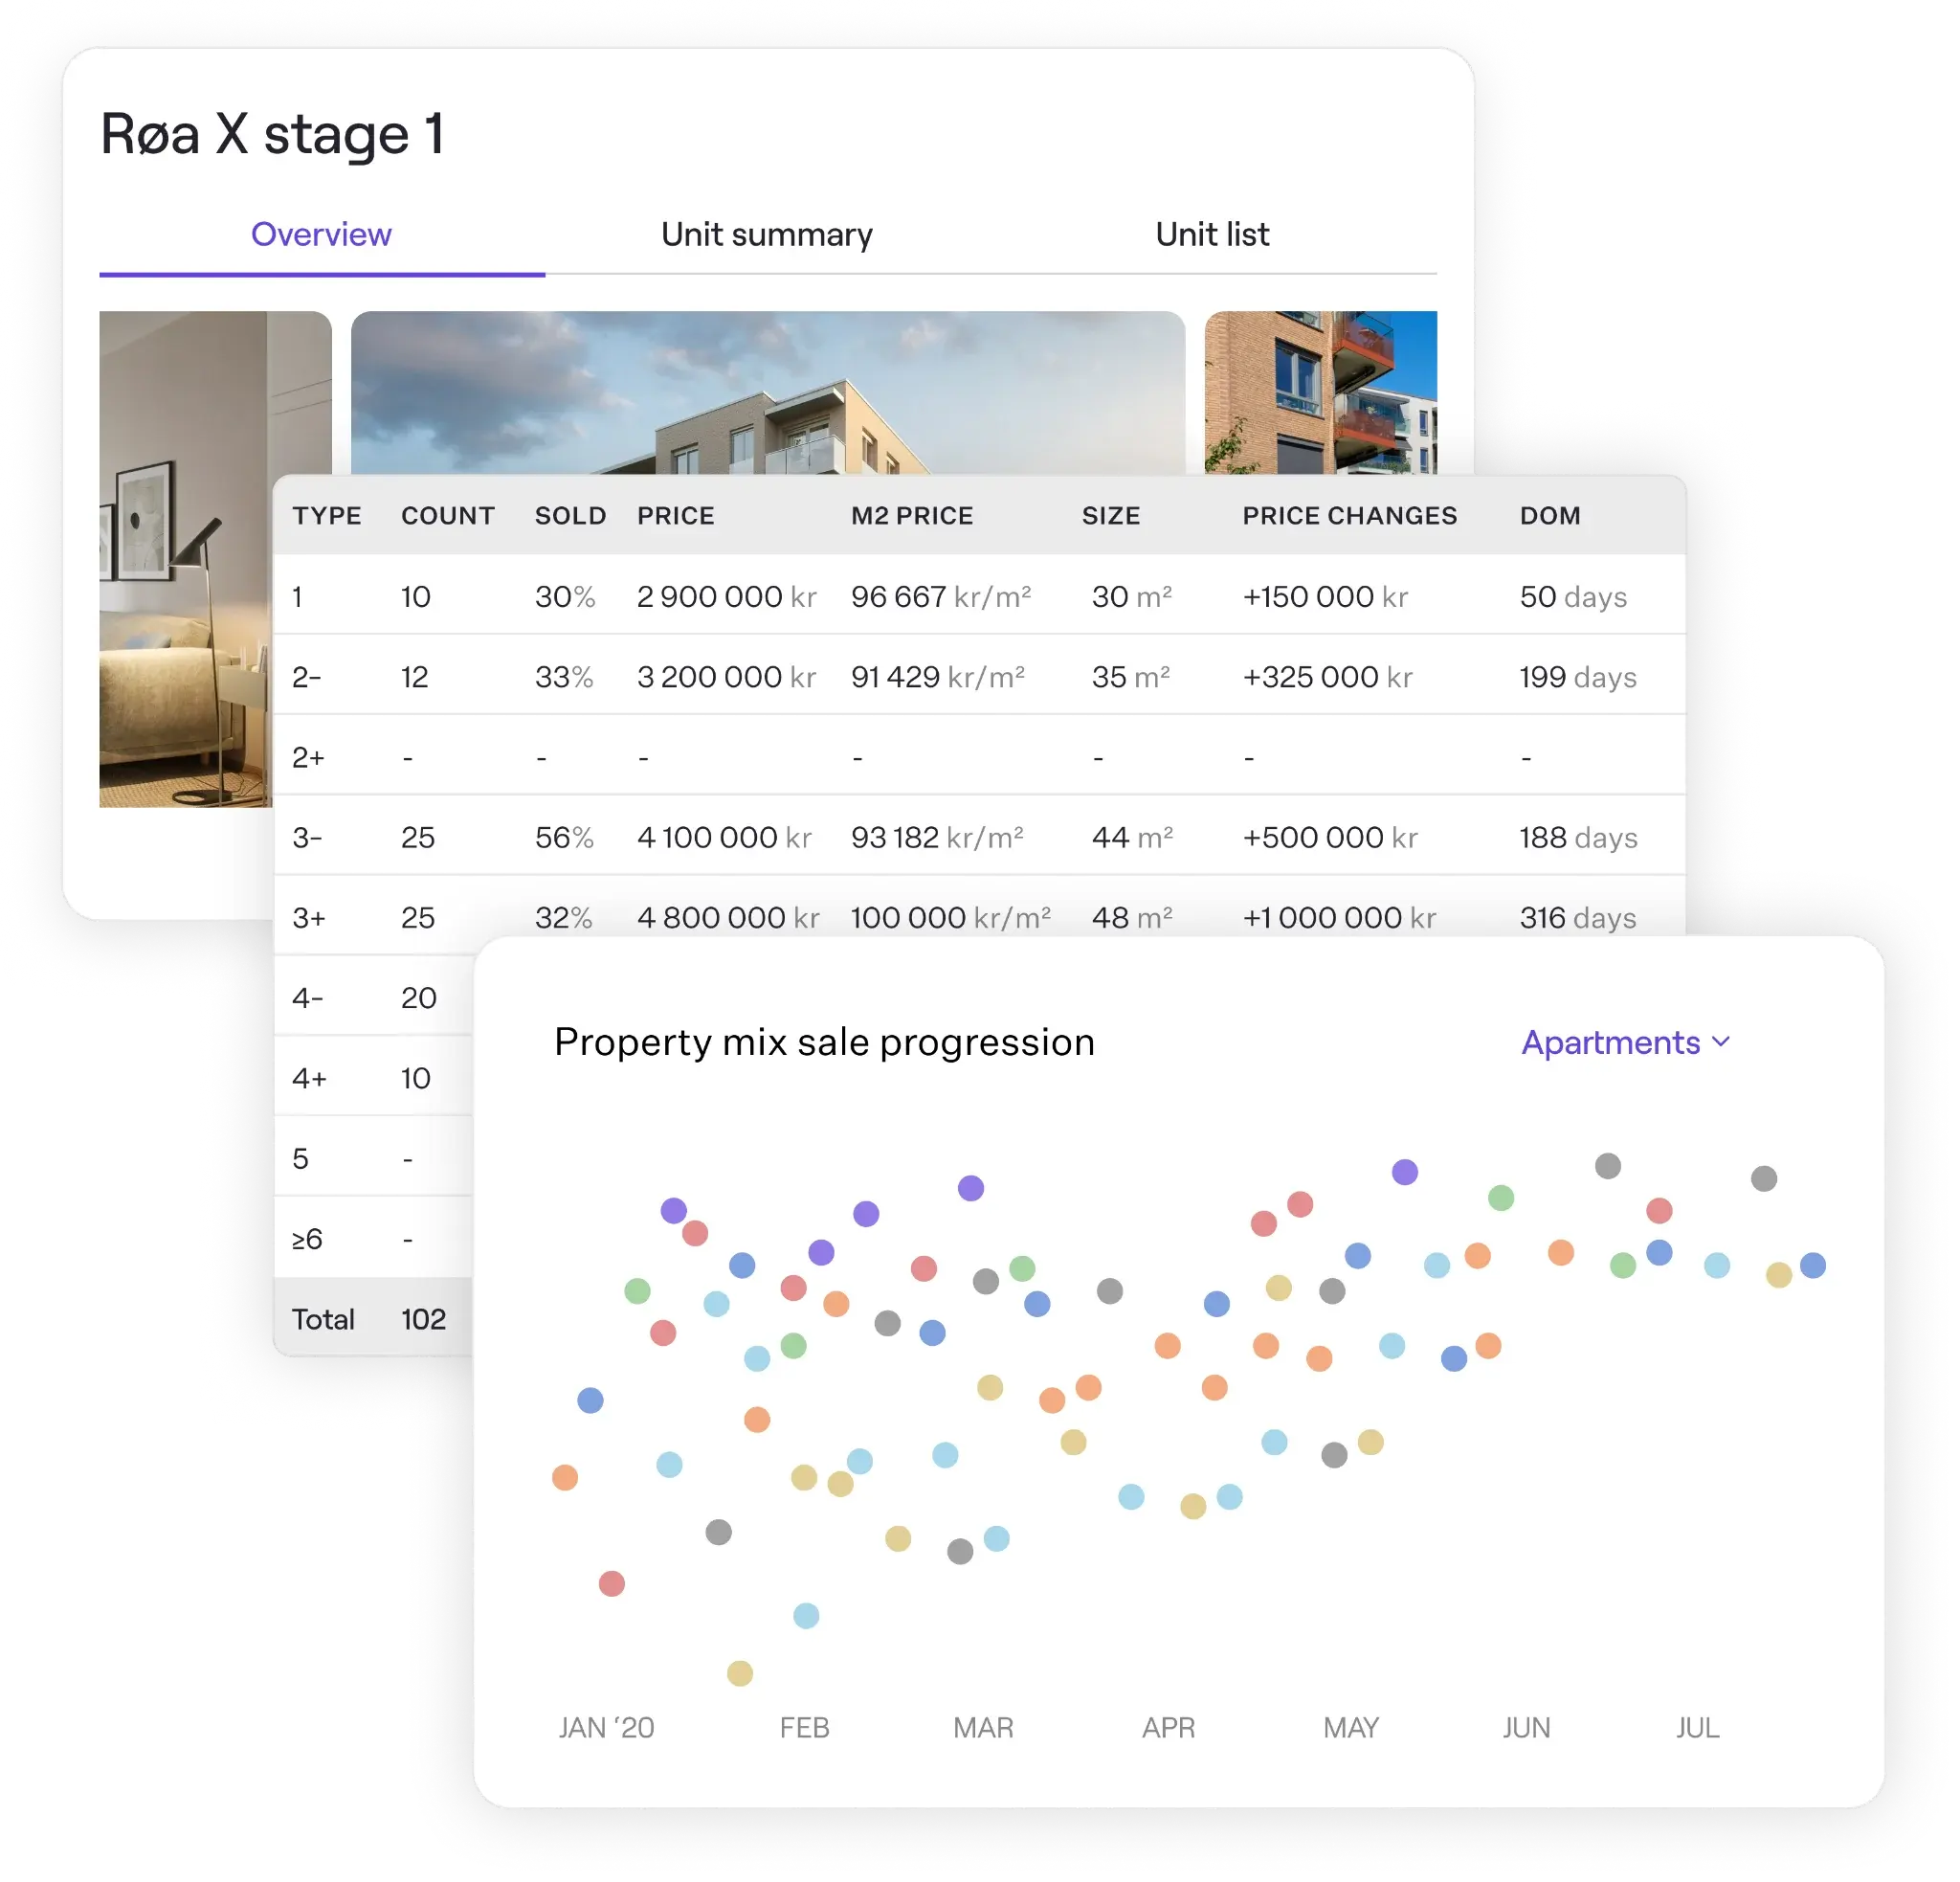
Inspect nearby projects
With more than 10.000+ projects you can stake out all active and historical projects in your area.
- Overall projects status and sales progress
- Fully detailed unit lists
- Unit mix per sales stage
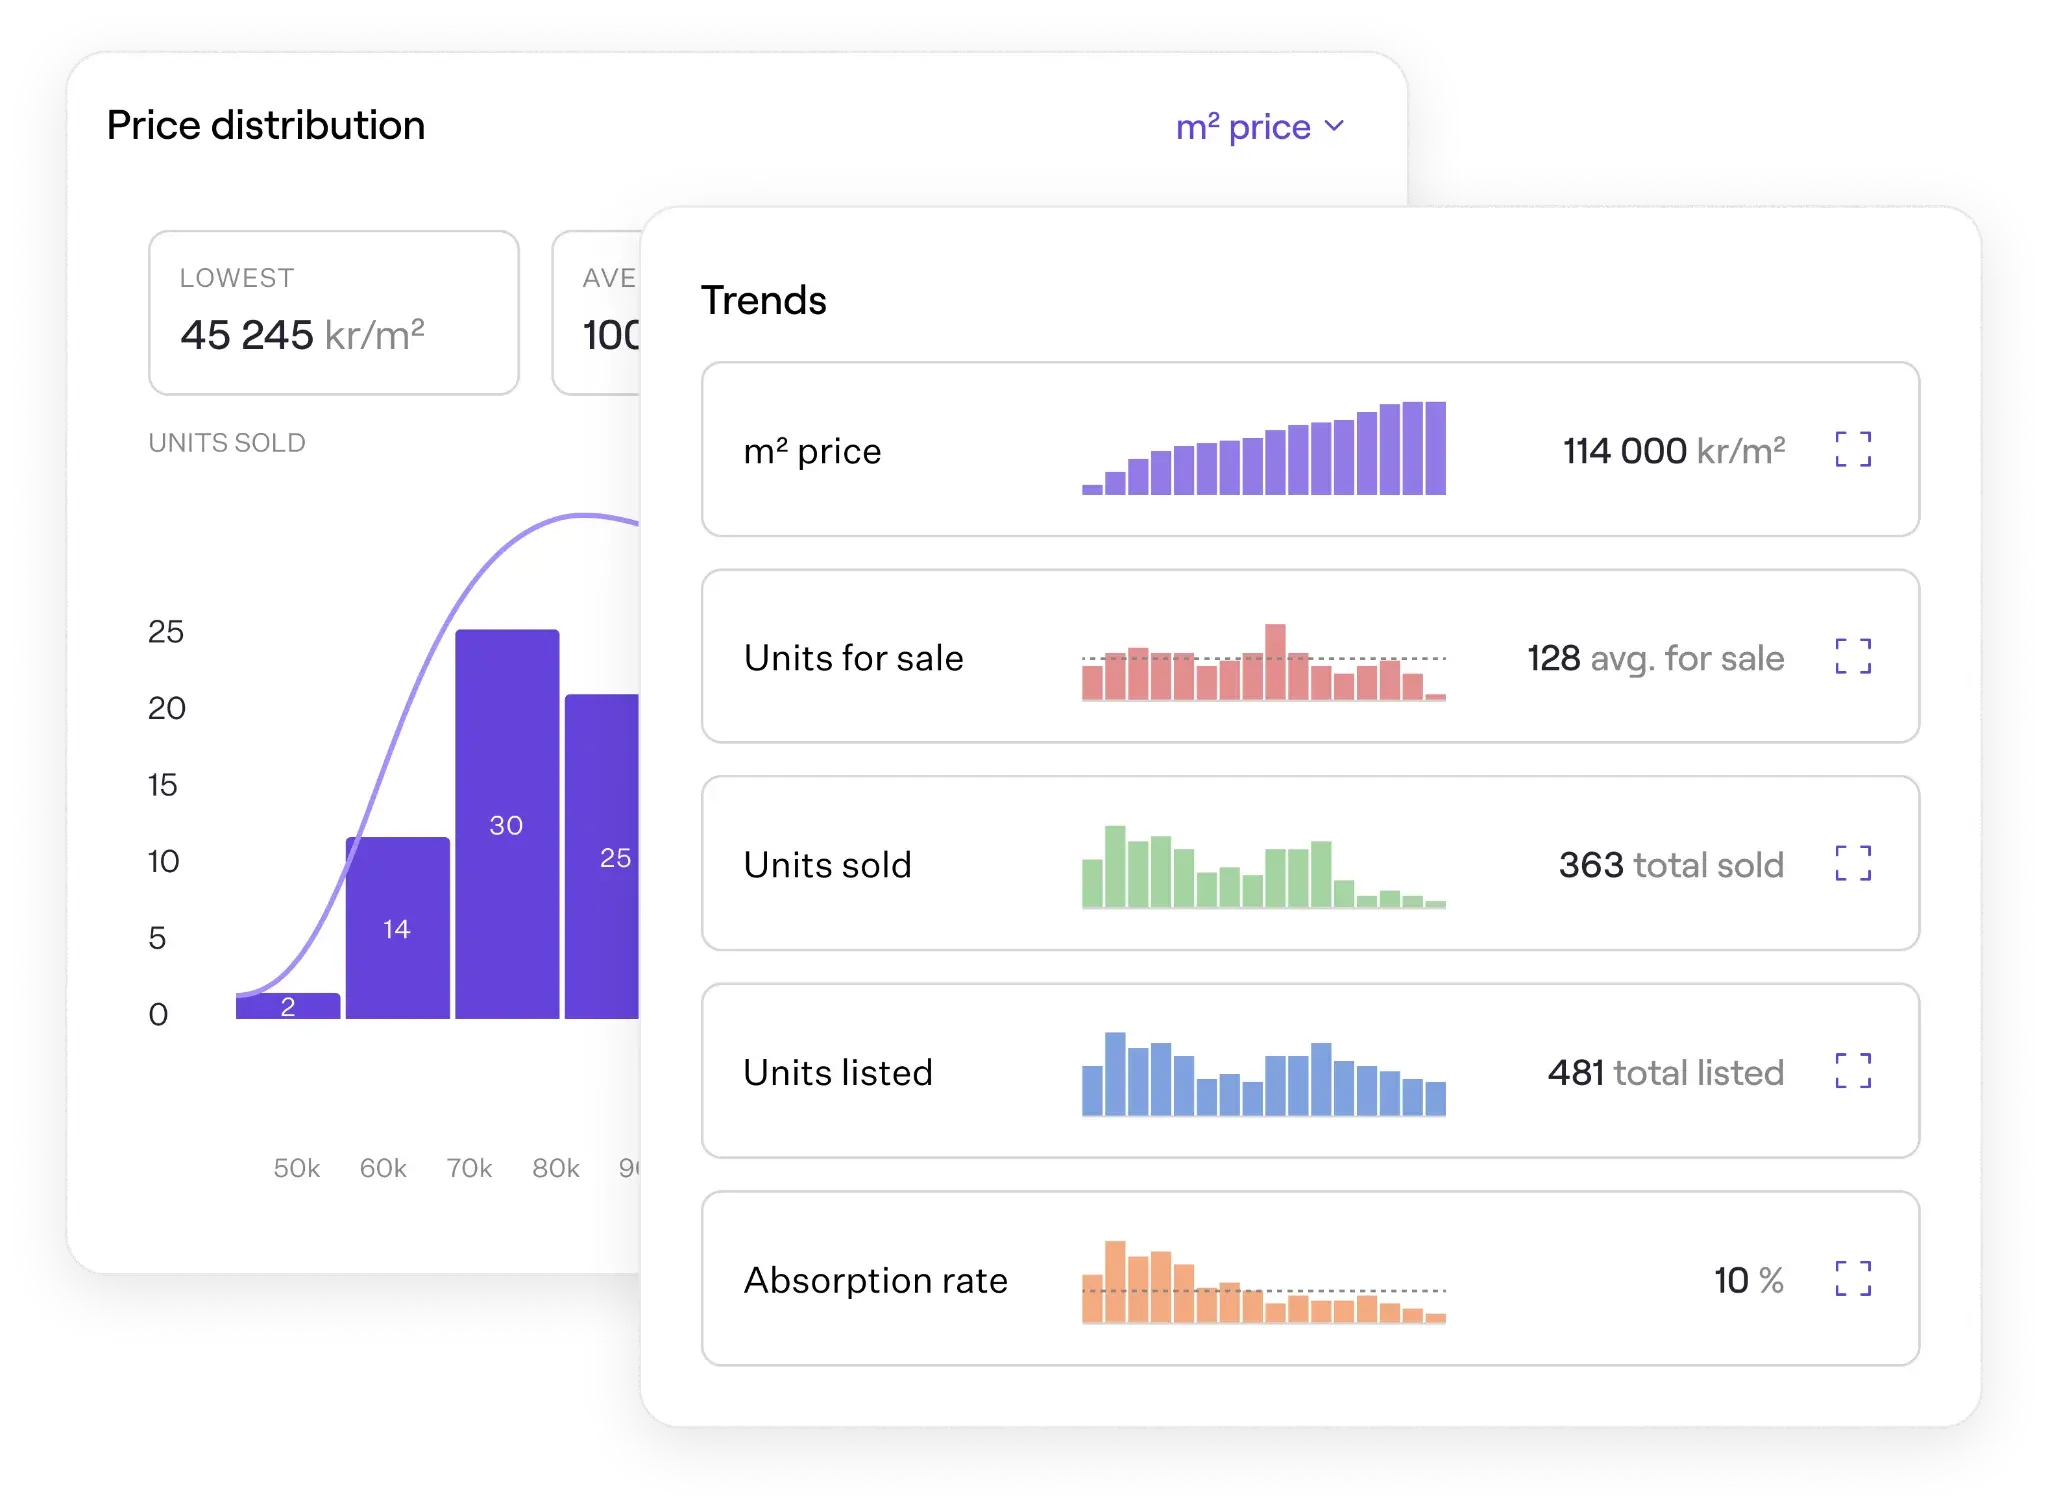
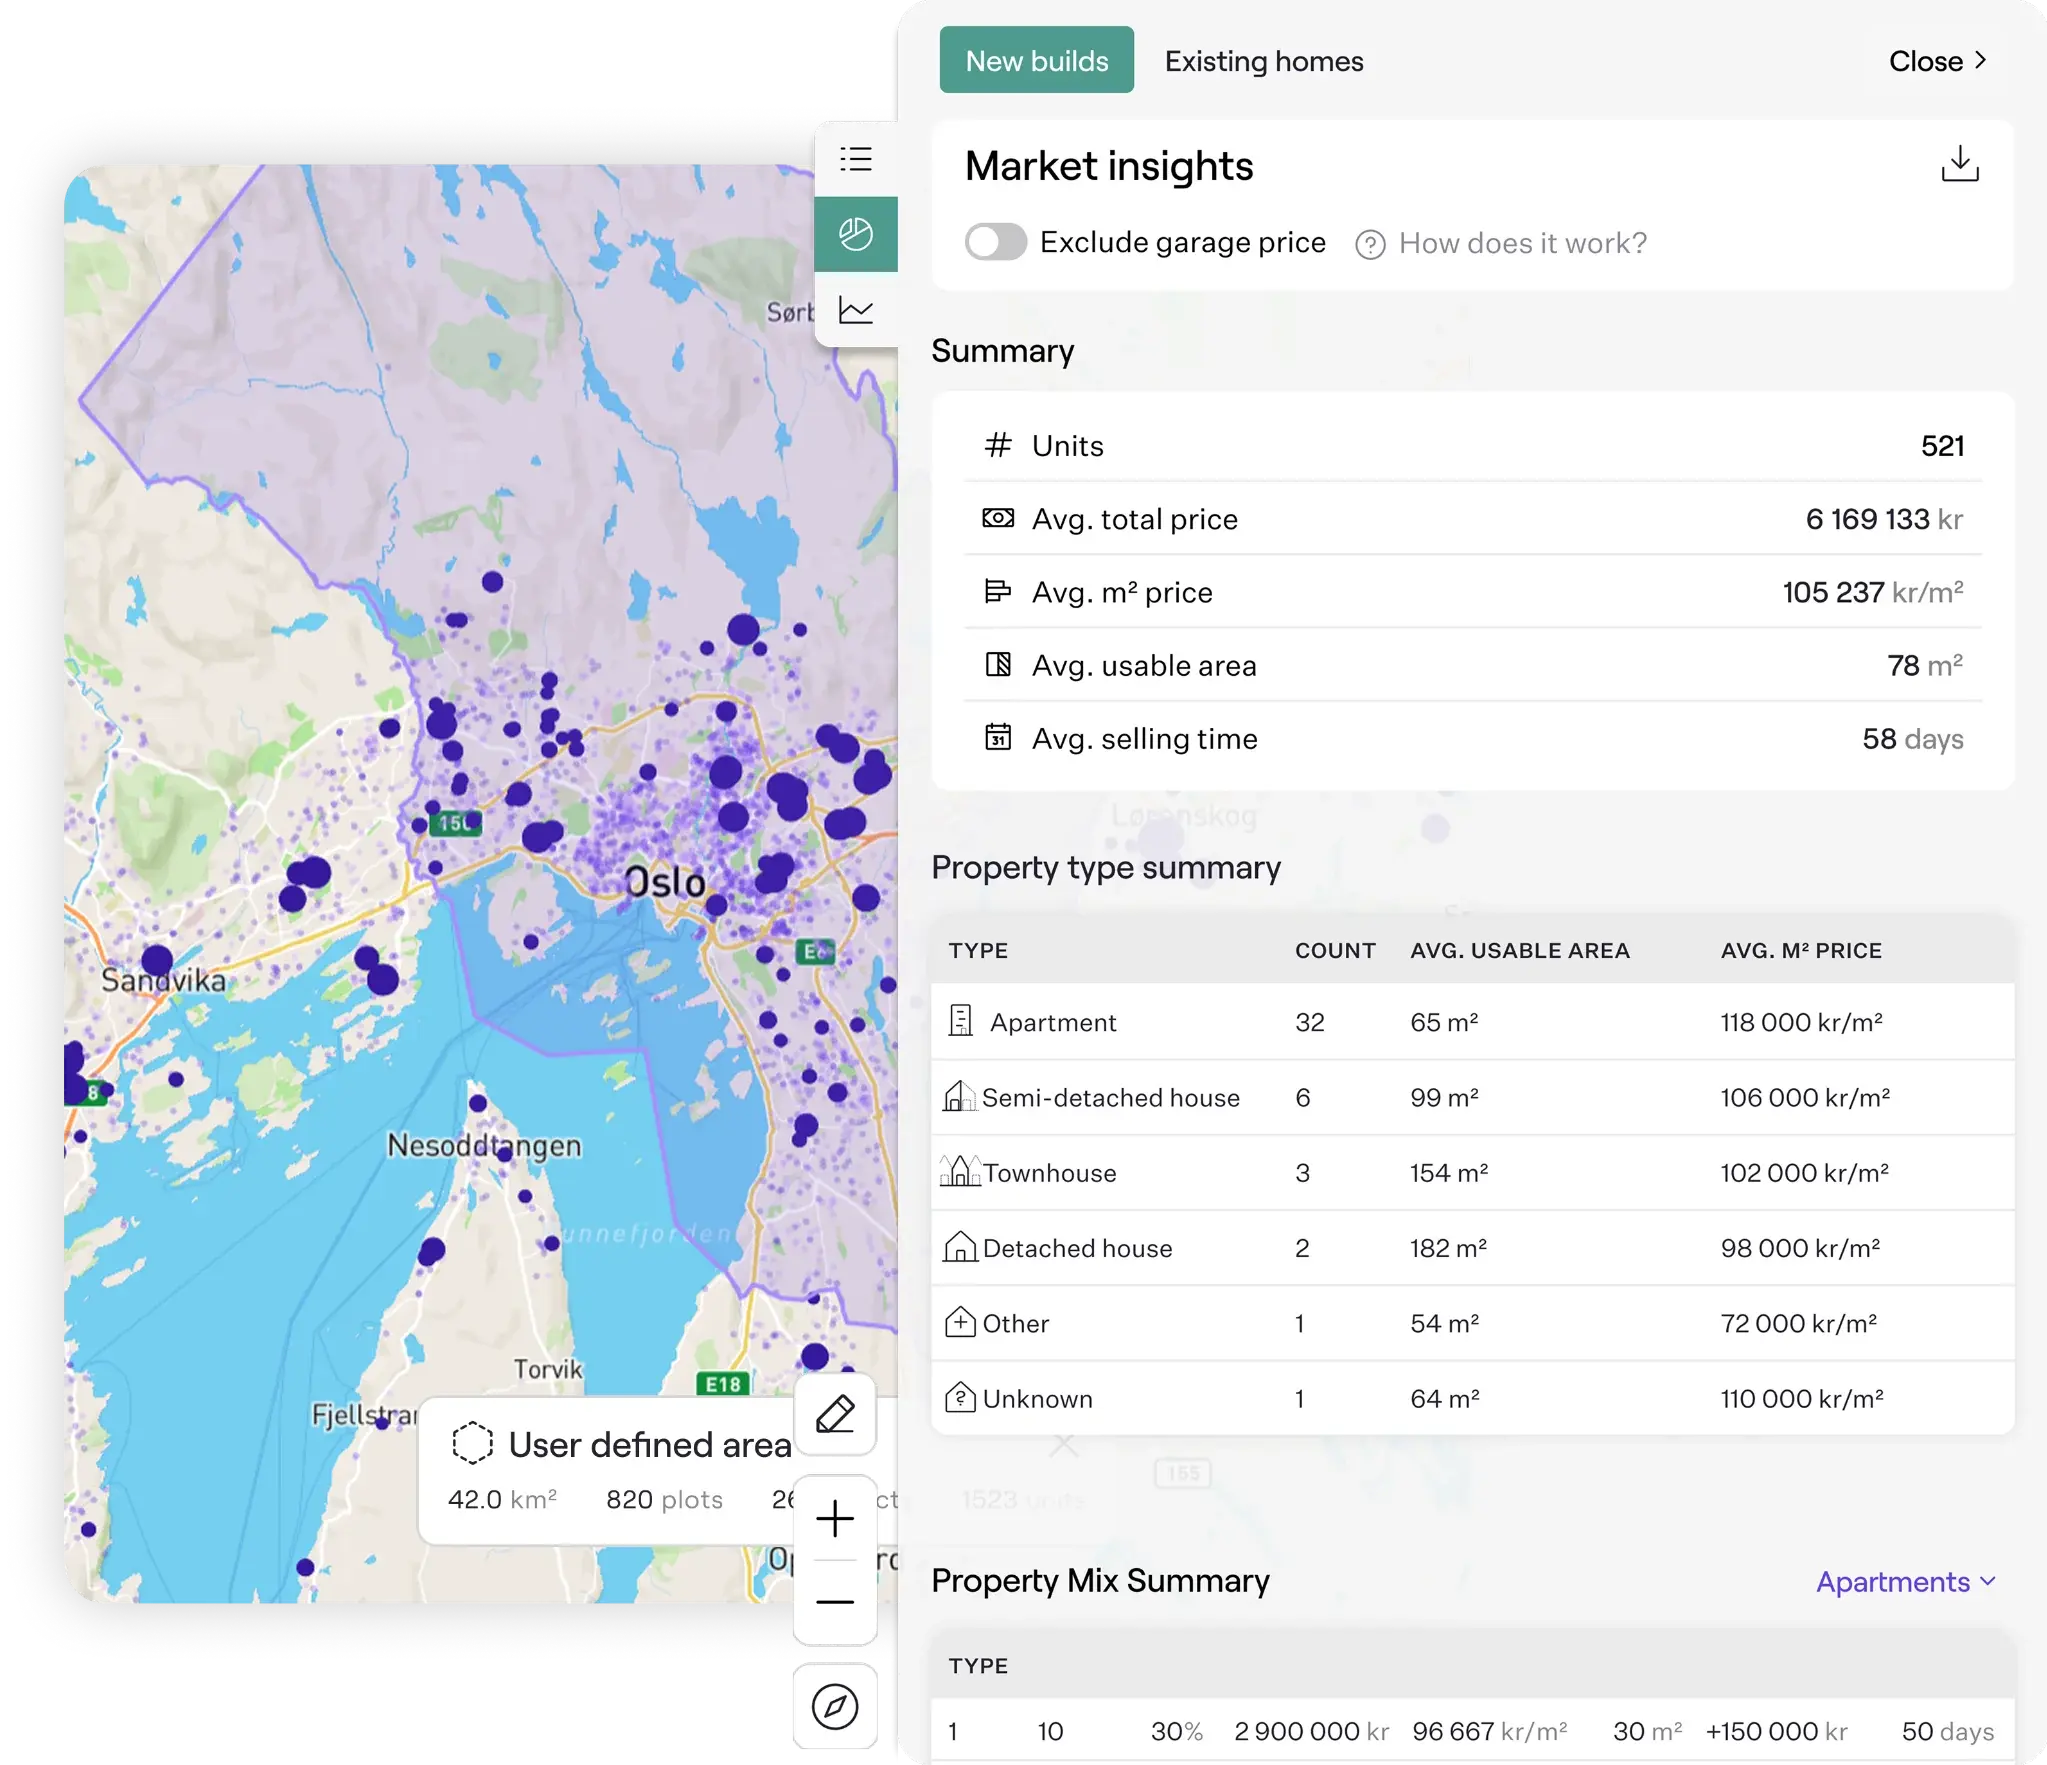
Market Insights
Easily visualize key data for a deeper understanding of any area at a glance.
- Essential charts for crucial area knowledge
- Property mix charts in any given area
- Current market availability and forecasted future needs
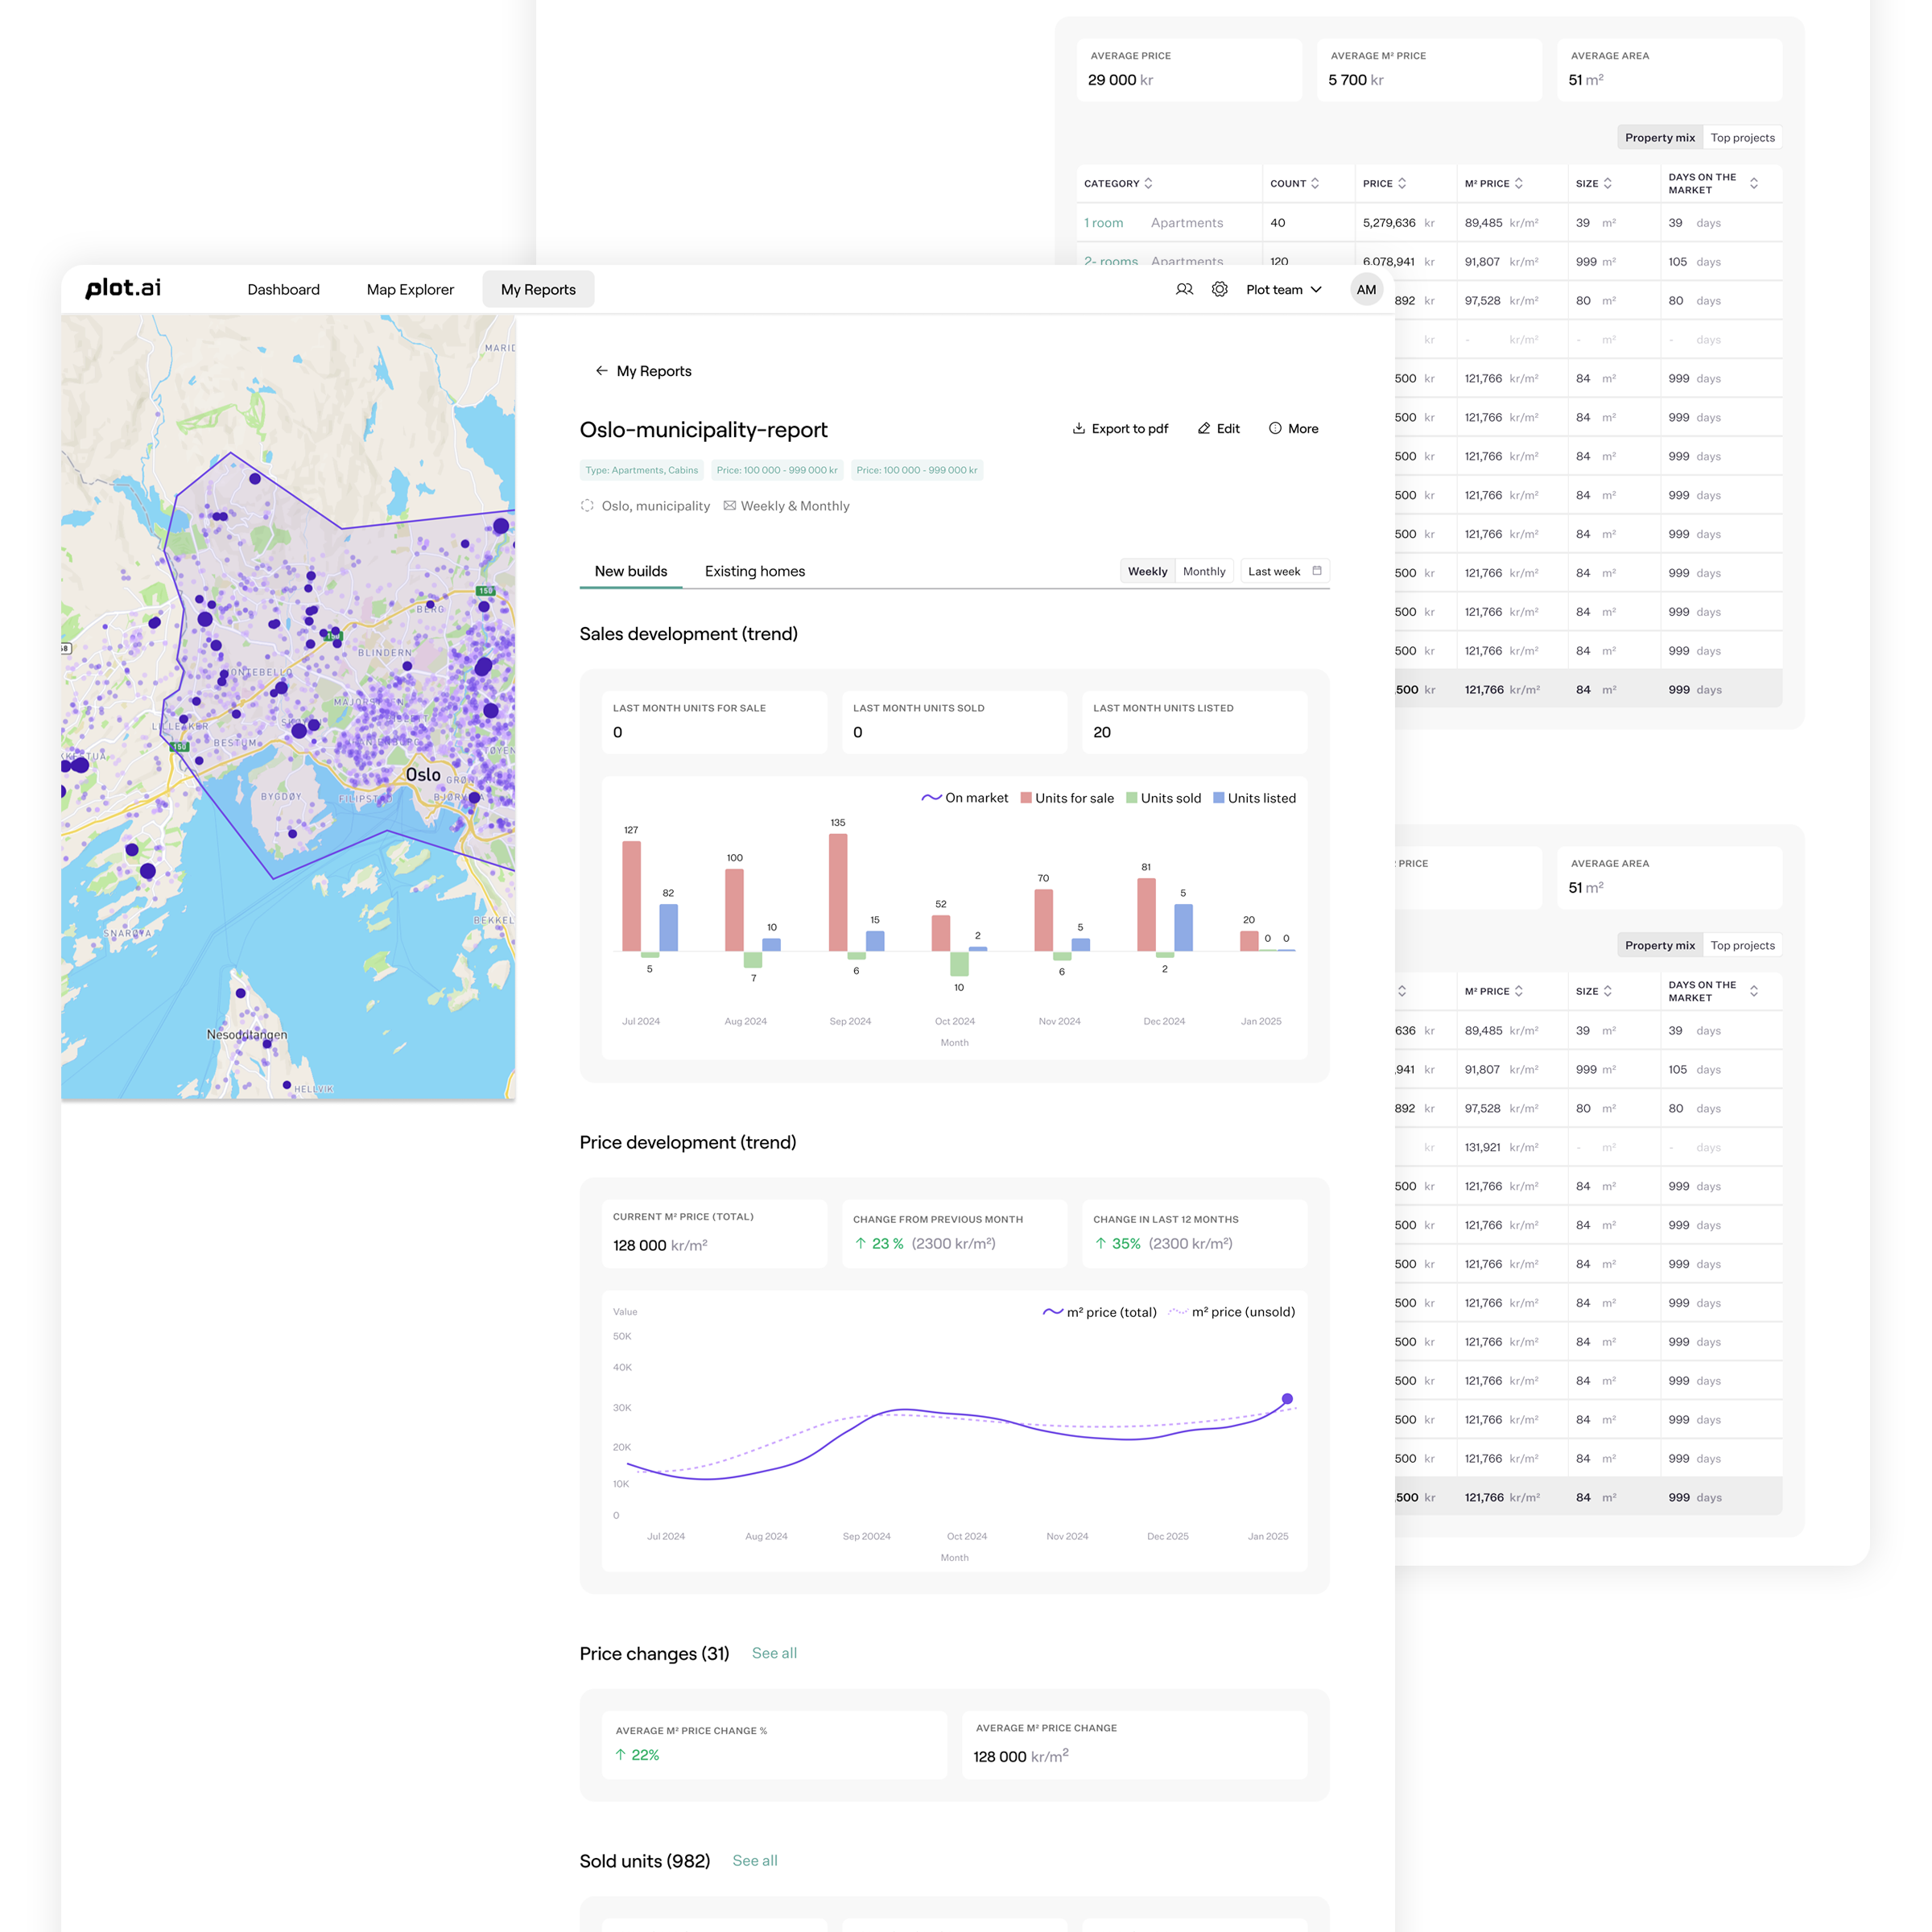
Reports
Get instant access to aggregated data from your selected area and make data-driven decisiones with ease.
- View comprehensive, location-based data in just a few clicks
- Identify trends and patters quickly with intuitive tools
- Stay informed with the latest available information
Easy to use interface
Your main view is an intuitive map with all our tools easily accessible.
- Find the area or project you want to view
- Navigate the interactive map by panning or zooming
- Add visualizations, draw, and filter the view as needed
Unlock Real Estate Insights with Plot.ai
Get instant access to real-time market data and trends. Analyze property prices, sales volumes, and more—all in one powerful platform.

Contact us
Need help? Feel free to reach out with any enquiry you may have.
